Classroom experiments and activities

Observations of various spectra with a home-made spectroscope
Université Pierre et Marie Curie
Paris, France
Center for Theoretical Physics, PAS
Warsaw, Poland
Have you already got your own spectroscope? If not, build a spectroscope following the instruction from here and point it at different sources of light. You will see that not every source of light shines in the same way. A spectroscope decomposes light that comes to you into components in a form of spectrum with use of diffraction grating. Two examples of such spectrum can be seen below:
 |
 |
We suggest here three exercises consisting in examining spectra of different sources of light, which can be done with use of your spectroscope. To do the exercise you will need a sheet of paper and something to write with, in order to put down the results of your observations. The spectra can also be photographed, but for the purpose of this exercise, a sheet of paper, a pen and possibly coloured felt-tips shall be just fine.
- 1. Observation of spectra of different sources of light and comparison of observation results with provided examples. This allows to identify different types of light bulbs - classical, energy-saving, fluorescent lamp.
- 2. Identification of the observed spectrum lines in emission spectra.
- 3. Observation of a yellow spectrum line of sodium.
- 4. Observation and identification of absorption lines in a spectrum of sunlight.
| Spectra around us |
 Download instruction (pdf)
Point your spectroscope at different sources of light in your environment: light bulbs in your flat, street lamps, neon signs advertising shops and goods. Draw each observed spectrum and compare it to the spectra presented below. Does any spectrum match an exemplary one? If so, which of the examples?
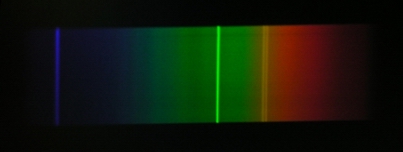
Let's start with a continuous spectrum. This is a source, whose light is composed of all visible colours: |
| spectrum 1 |
|
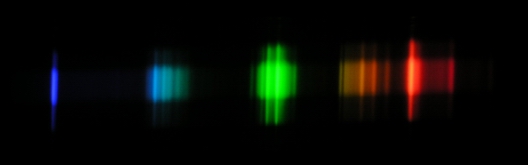
| spectrum 2 |
|
| spectrum 3 |
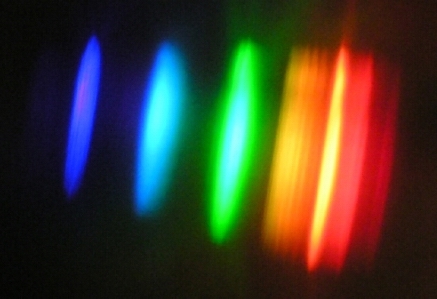 |
| spectrum 4 |
Spectrum no. 2 - a fluorescent lamp of the old type.
Spectrum no. 3 - a fluorescent lamp of the new type. It has a richer spectrum and its light is more like sunlight.
Spectrum no. 4 - an energy-saving bulb.
Discuss conclusions drawn
from your observations with your classmates.
Have you succeeded, basing on the spectrum, in defining what sources of light can be found in your neighbourhood? If you find a lamp whose spectrum differs from the ones presented in this exercise, you can search spectra of different lamps in the Internet.
If you find the spectra of elements interesting, we recommend you to visit Java illustrating spectra of elements.
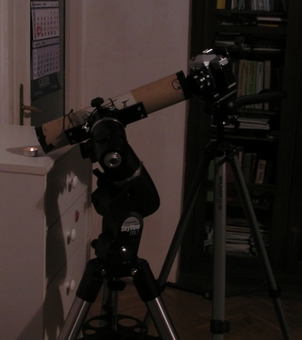 |
| Fig. 1: A spectroscope with a camera, prepared to photograph a spectrum of a candle |
Try to find a bit burnt-out candle, in which there is a small depression in a stearin around the wick. Pour some salt around the wick and light your candle. The experiment shall be conducted in a darkened room or in the evening, in order to reduce the background impact, as the flame of a candle is not very bright. In a spectroscope you will see a clear, yellow line. This is a famous sodium doublet, two closely located lines (resolving power of our home-made spectroscope does not allow to separate them), which comes from sodium (Na) emission:
 |
| Fig. 2: A spectrum of a candle with a salted wax. An orange sodium line is clearly visible. |
Think about a chemical formula of a table salt. Does it contain sodium?
Warning! Be extremely careful not to bring about fire! |
| Fig. 3: Visible continuous
spectrum
|
Print an image of a continuous spectrum and draw on it location of spectrum lines in spectra of lamps observed with your spectroscope. Below you will find some information on wavelength corresponding to emission lines in spectra of different lamps.
1. spectrum of a fluorescent lamp of the old type:
 |
| Fig. 4: Intensity of spectrum lines in wavelength function in a fluorescent lamp of the old type |
| Line number | Wavelength (nm) | Element |
| 1 | 364.24 | mercury |
| 2 | 403.53 | mercury |
| 3 | 434.83 | mercury |
| 4 | 545.63 | mercury |
| 5 | 576.35 | probably mercury |
| 6 | 578.15 | probably mercury |
As you can see, it is a simple spectrum, so you should have no problems to identify spectrum lines. Moreover, all spectrum lines in visible light come from one element - mercury.
 |
| Fig. 5: Intensity of spectrum lines in wavelength function in a modern fluorescent lamp |
Spectra of modern fluorescent lamps are much more complicated, because they shine with light similar to sunlight. Such spectrum has more lines, which makes an identification more difficult.
| Line number | Wavelength [nm] | element |
|
|---|---|---|---|
| 1 | 405.4 | mercury |
|
| 2 | 436.6 | mercury | |
| 3 | 487.7 | terbium Tb3+ | |
| 4 | 542.4 | terbium Tb3+ | |
| 5 | 546.5 | mercury |
|
| 6 | 577.7 | probably terbium Tb3+ or mercury | |
| 7 | 580.2 | mercury or terbium Tb3+ | |
| 8 | 584.0 | probably terbium Tb3+ or europium Eu+3:Y2O3 | |
| 9 | 587.6 | probably europium Eu+3:Y2O3 | |
| 10 | 593.4 | probably europium Eu+3:Y2O3 | |
| 11 | 599.7 | probably europium Eu+3:Y2O3 | |
| 12 | 611.6 | europium Eu+3:Y2O3 | |
| 13 | 625.7 | probably terb Tb3+ | |
| 14 | 631.1 | probably europium Eu+3:Y2O3 | |
| 15 | 650.8 | probably europium Eu+3:Y2O3 | |
| 16 | 662.6 | probably europium Eu+3:Y2O3 | |
| 17 | 687.7 | probably europium Eu+3:Y2O3 | |
| 18 | 693.7 | probably europium Eu+3:Y2O3 | |
| 19 | 707 et 709 | probably europium Eu+3:Y2O3 | |
| 20 | 712.3 | prawdopodobnie europium Eu+3:Y2O3 | |
| 21 | 760.0 | probably argon Ar | |
| 22 | 811.0 | probably argon Ar |
Having all that data we can start our exercise:
II. try to identify the spectrum, that is to ascribe it to a particular type of a lamp. To achieve it, you have to compare location of the observed spectrum lines with location of spectrum lines of different lamps, by means of determined wavelengths of different spectrum lines. Beware of different scales in different figures!
III. look at the tables below the images of spectra and find elements whose emission is responsible for the particular lines;
| Lamp type | Line description | Wavelength | Element | Distinctive features |
|---|---|---|---|---|
| eg. halogen bulb | e.g. group of blue lines, poorly visible |
V. when you have completed your exercise, compare your results with your classmates.
To observe a spectrum of sunlight, you must build a spectroscope with a long tube. The longer the tube of a spectroscope, the better resolving power and the less significant influence of imprecision resulting from slit making. This exercise is based on observations with a spectroscope made of a 1-meter tube. Such tubes are easily accessible in the Internet and are quite cheap.
WARNING!!! Under no circumstances you should look at the Sun, because you can damage your eyesight.
It is not necessary to look directly at our daily star, in order to observe its spectrum. If in a nice, sunny day we point our spectroscope at a clear sky, we shall observe a spectrum of a diffused sunlight. On the continuous spectrum we should clearly see several dark lines. They are absorption lines coming from absorption of light by elements occurring in external layers of the Sun's atmosphere. They are known as Fraunhofer lines, because that is the name of one of their discoverers.
Below you can see a set prepared to photograph a spectrum of sunlight: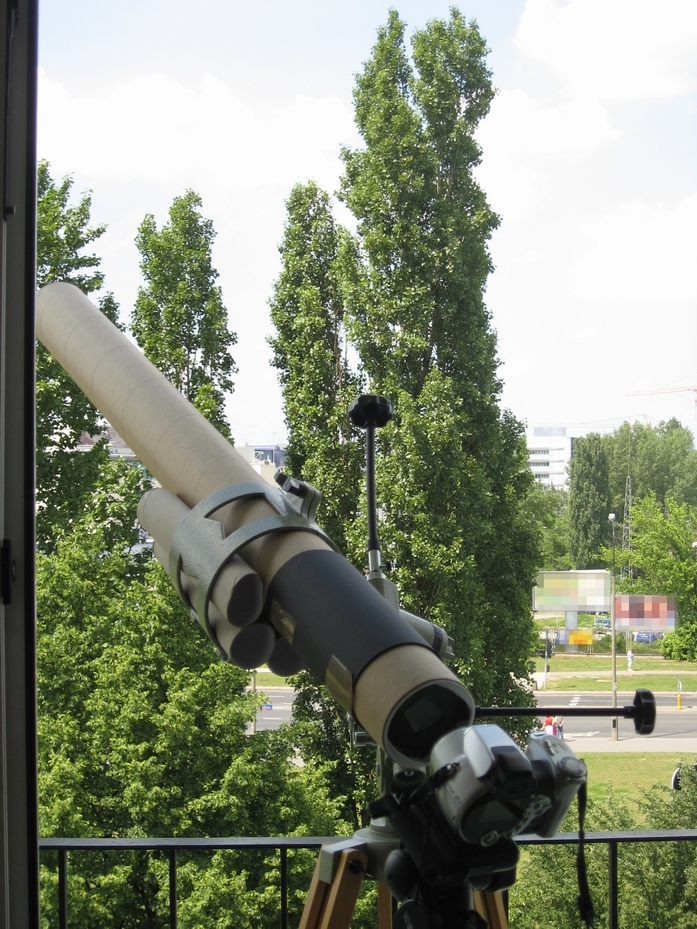 |
| Fig. 6: Spectroscope with a camera prepared to photograph a spectrum of sunlight |
It is recommended to cover your eyes/camera with some diaphragm, like the one visible in the photo, a sleeve made from a black cardboard fixed to a spectroscope. It will enable to enhance contrast and will improve spectrum visibility.
This photograph presents a spectrum of sunlight with Fraunhofer lines:
 |
 |
Basing on the image and the table below try to identify the visible lines:
| Line | Element | Wavelength [nm] |
|---|---|---|
| A -band | O2 | |
| B -band | O2 | |
| C | H | 656.3 |
| a -band | O2 | |
| D -1, 2 | Na | 589.6, 589.0 |
| E | Fe | 527.0 |
| b -1, 2 | Mg | 518.4, 517.3 |
| c | Fe | 495.8 |
| F | H | 486.1 |
| d | Fe | 466.8 |
| e | Fe | 438.4 |
| f | H | 434.0 |
| G | Fe i Ca | 430.8 |
| g | Ca | 422.7 |
| h | H | 410.2 |
| H | Ca | 396.8 |
| K | Ca | 393.4 |
Can you identify sodium doublet D? These are absorption lines matching emission line of table salt, which have been observed in part II.
The last step is to compare your results with the ones of your classmates.